- This event has passed.
LECTURE: Drawing the Line
June 21, 2024 @ 5:00 pm - 6:00 pm UTC+1
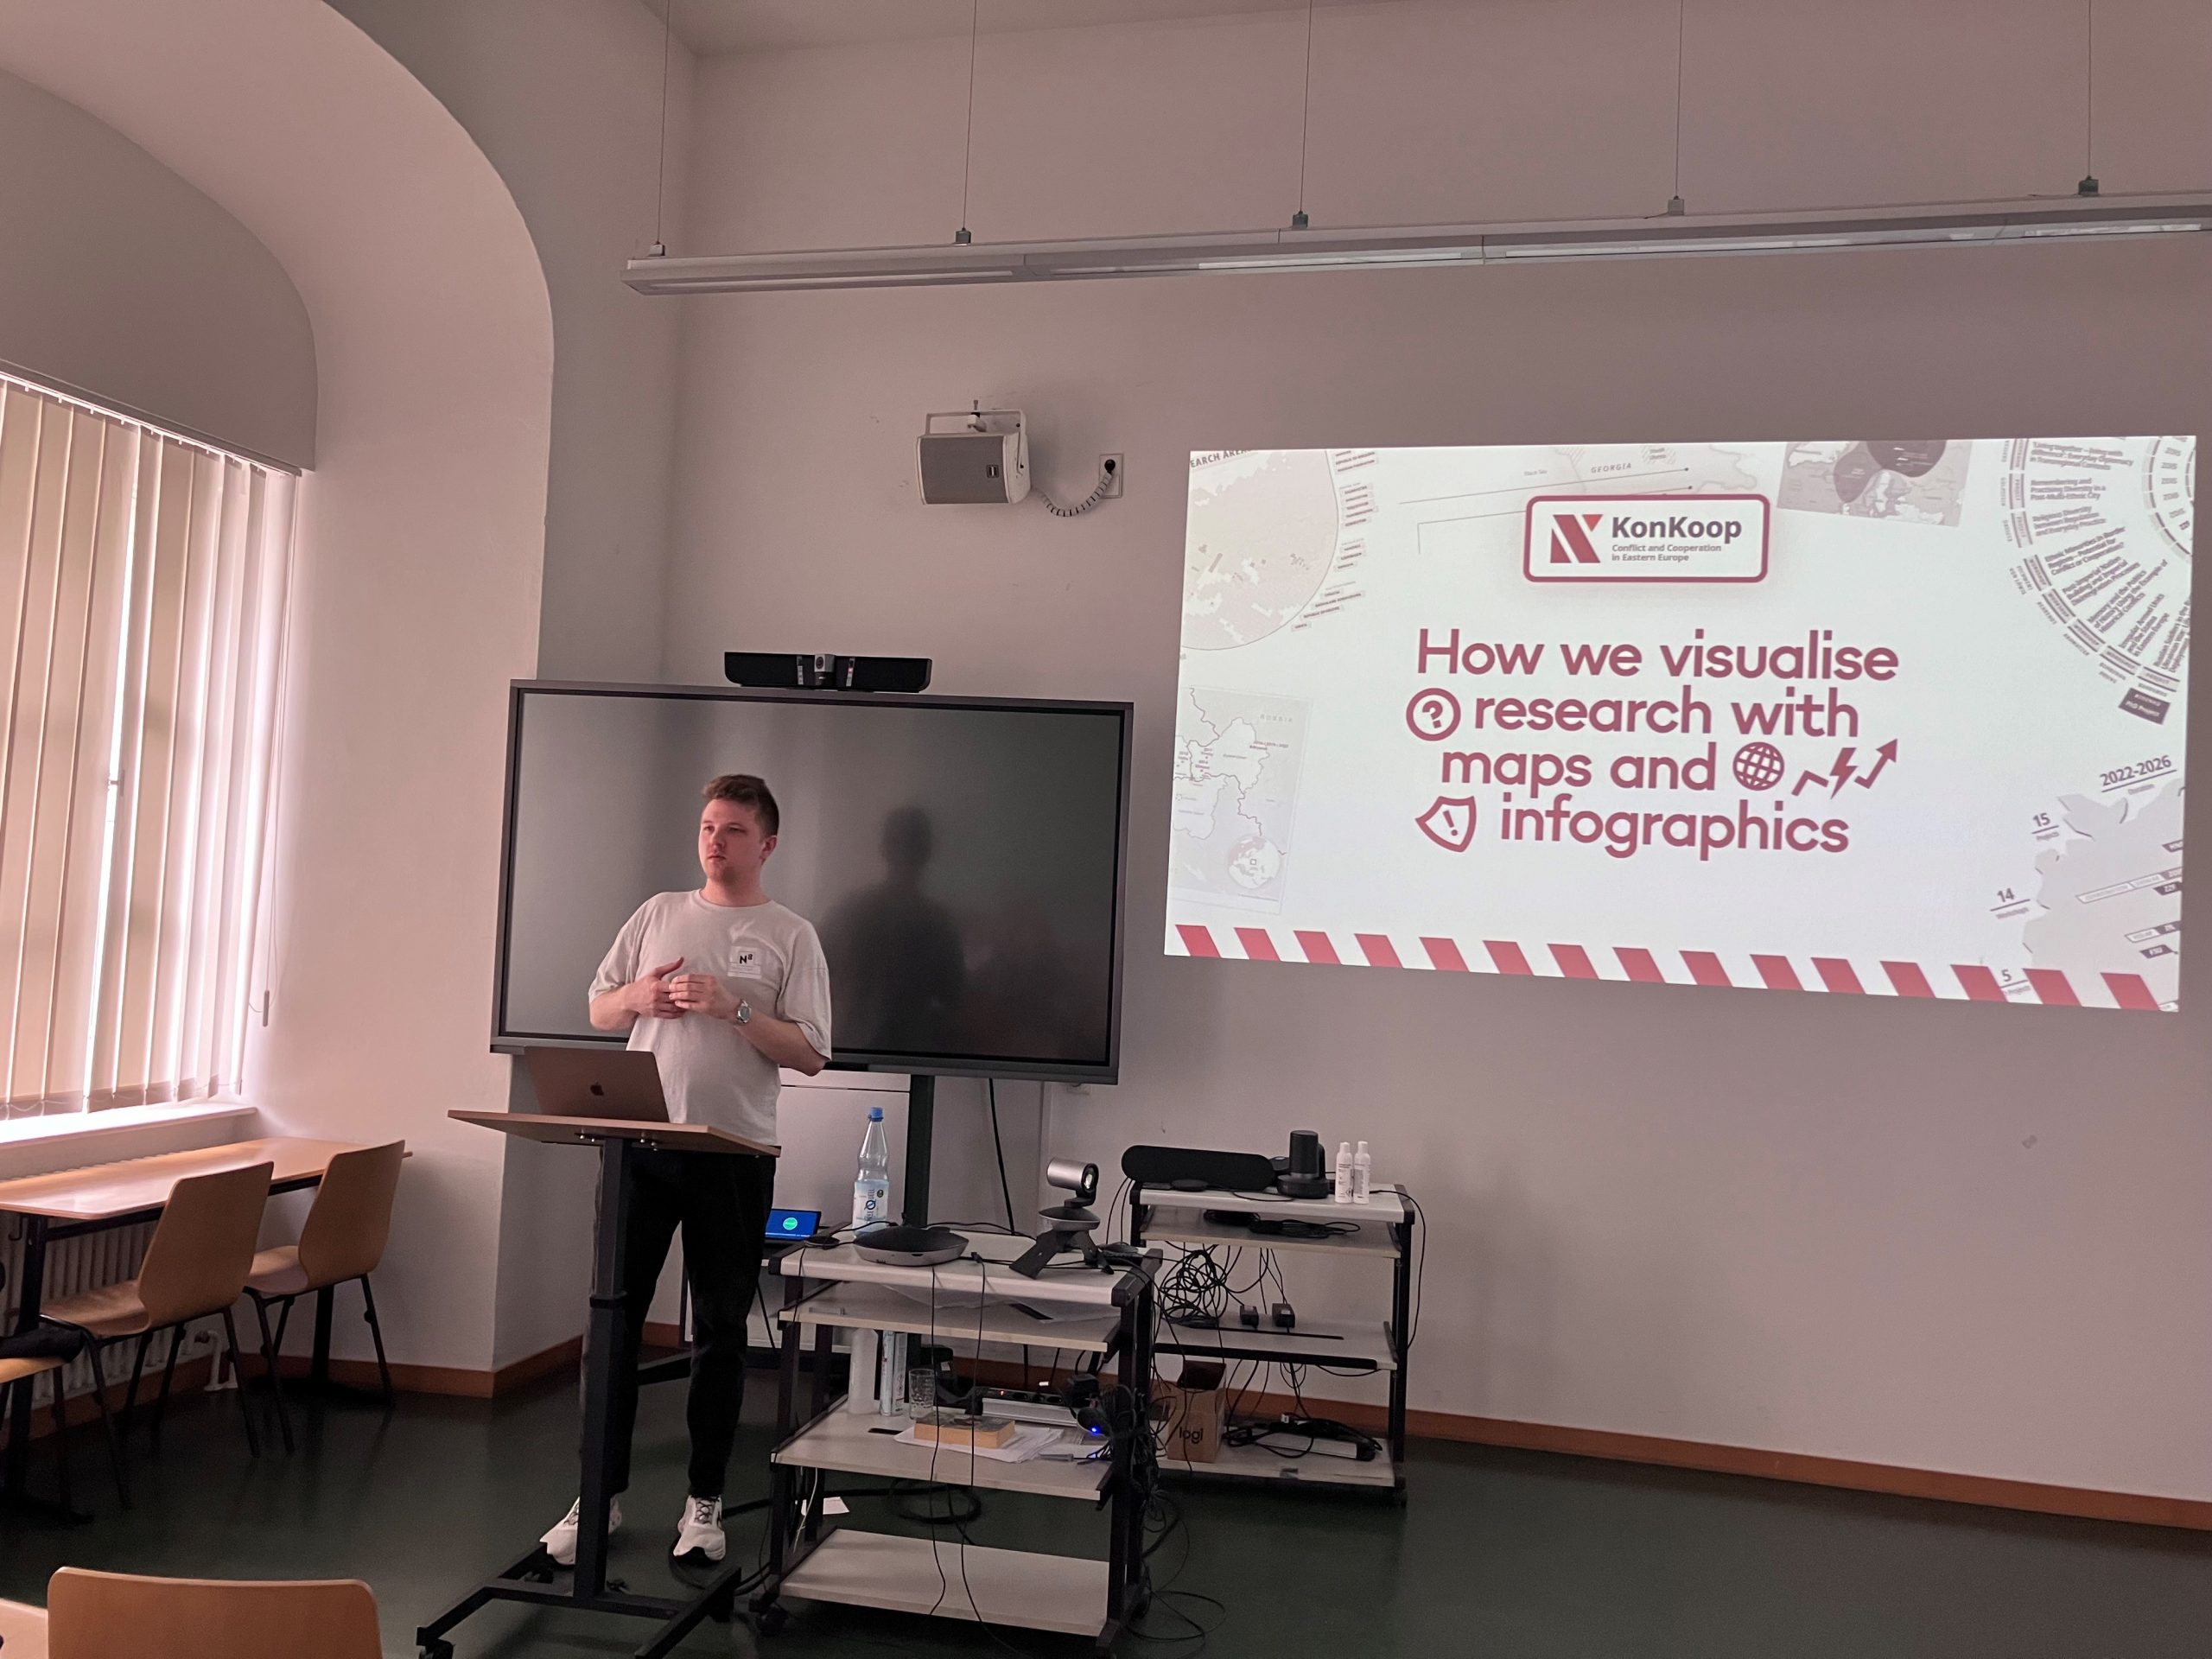
How We Visualise Research with Maps and Infographics
By Iaroslav Boretskii (ZOiS) within the Long Night of the Sciences
In conflict studies, maps and infographics can be a useful tool for visualising research insights. Visualisation is integral to KonKoop, a network that studies conflict and cooperation in Eastern Europe since the end of the Cold War. The network’s two multidisciplinary laboratories – a DataLab (ZOiS, Berlin)and a VisLab (IfL Leipzig) – develop conceptual and practical approaches to visualising their research. Their maps and graphics will form part of the planned Atlas of Peace and Conflict Visualisations. In this presentation, we present examples and explain which principles guide the process.