Visualising Peace and Conflict
The VisLab aims to explore and enhance the methods and practices of visualising peace and conflict. Drawing on the analysis of visualisations and best practices, the VisLab will explore and propose a variety of visualisation approaches related to the topic lines and case studies in the KonKoop project. The VisLab and KonKoop researchers will discuss different types of data that can be visualised within each of the individual projects, and work together with the partners and the DataLab to produce maps and visualisations for each specific context. This work will result in an Atlas of Peace and Conflict Cartography, imagined as a digital output comprising of:
- Case Study Visualisations: In visualising the KonKoop case studies, the focus will be on revealing complexity through multiperspectivity, rather than producing fixed and stabilised visualisations. This will take place by experimenting with visualisation methods that compare, confront, juxtapose, stitch together and/or fragment cartographic approaches and ways of seeing.
- Visual Essays on Peace and Conflict Cartography: The VisLab will discuss the process and approach of each case study visualisation in an essay that reveals its ‘backend’ production and brings it into a dialogue with historical maps and relevant examples.
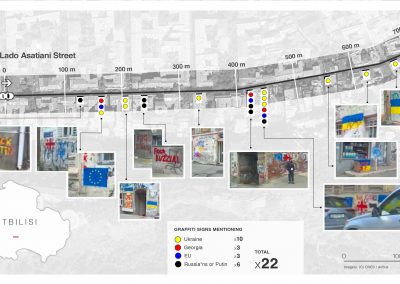
Map of Lado Asatiani Street for Researching Living with/in Difference Creatively KonKoop Workshop (March 19-20, 2024) by Tsypylma Darieva
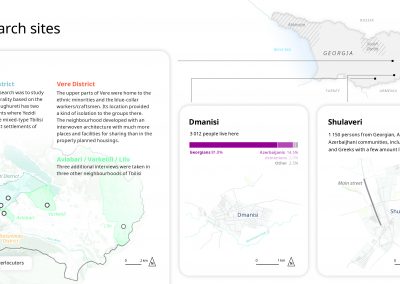
Research sites in Tbilisi for Researching Living with/in Difference Creatively KonKoop Workshop (March 19-20, 2024) by Tsypylma Darieva
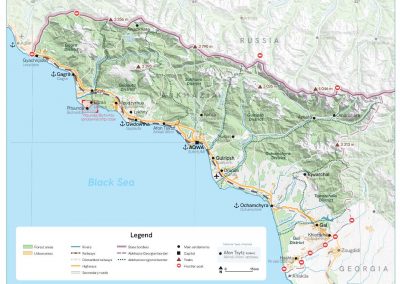
Map of Abkhazia for C2: Economic Agency in the Context of Unrecognised Statehood by Lena Pieber
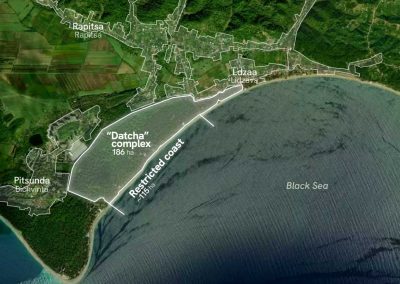
Map of Pitsunda / Bichvinta Case Study for C2: Economic Agency in the Context of Unrecognised Statehood by Lena Pieber
Here you can find relevant updates and materials related to the VisLab’s analysis of peace and conflict visualisations.


